What Compiled Orchestration Buys You: 3M Events/s in a Browser JVM
The same Java-authored price-ladder graph runs at roughly three million events per second in a browser and about fifty million per second on a desktop JVM. The interesting part is not only the number: the execution graph, generated Java and audit path remain visible.
In Graph Engineering Needs a Compiler, I argued that a closed application graph should become a compiled orchestrator rather than remain runtime routing metadata.
Determinism and auditability were the main argument. Performance is the mechanical consequence.
Once a compiler has already decided which component can run, in what order, and under which change conditions, the runtime has much less work left to do. It does not need to traverse a graph, interpret edge metadata, search for subscribers or hand each event to a generic scheduler. It executes a compact Java method containing direct calls in a precomputed order.
The result below is a normal Java-authored price-ladder pipeline running inside a browser Java environment:
PriceLadder event
       ↓
Mid calculation
       ↓
Apply skew
       ↓
Limit visible levels
       ↓
Publish and distribute
The captured run processed 14.81 million events in five seconds: 2.96 million events per second. Its median batch-average cost was 329 ns per event and the p99 batch average was 440 ns per event, measured over 10,000-event batches. The Java heap delta was 0 B and the runtime reported no Java garbage collections during the run.
The live benchmark is public, requires no account or API key, and runs on desktop and phone browsers. Results vary by device; a recorded iPhone Safari run is around 2.75 million events per second. The point is not that every phone will report exactly the same number. The point is that an ordinary Java event processor, loaded with its supporting runtime and libraries, can still sustain millions of complete pipeline evaluations per second in a browser.
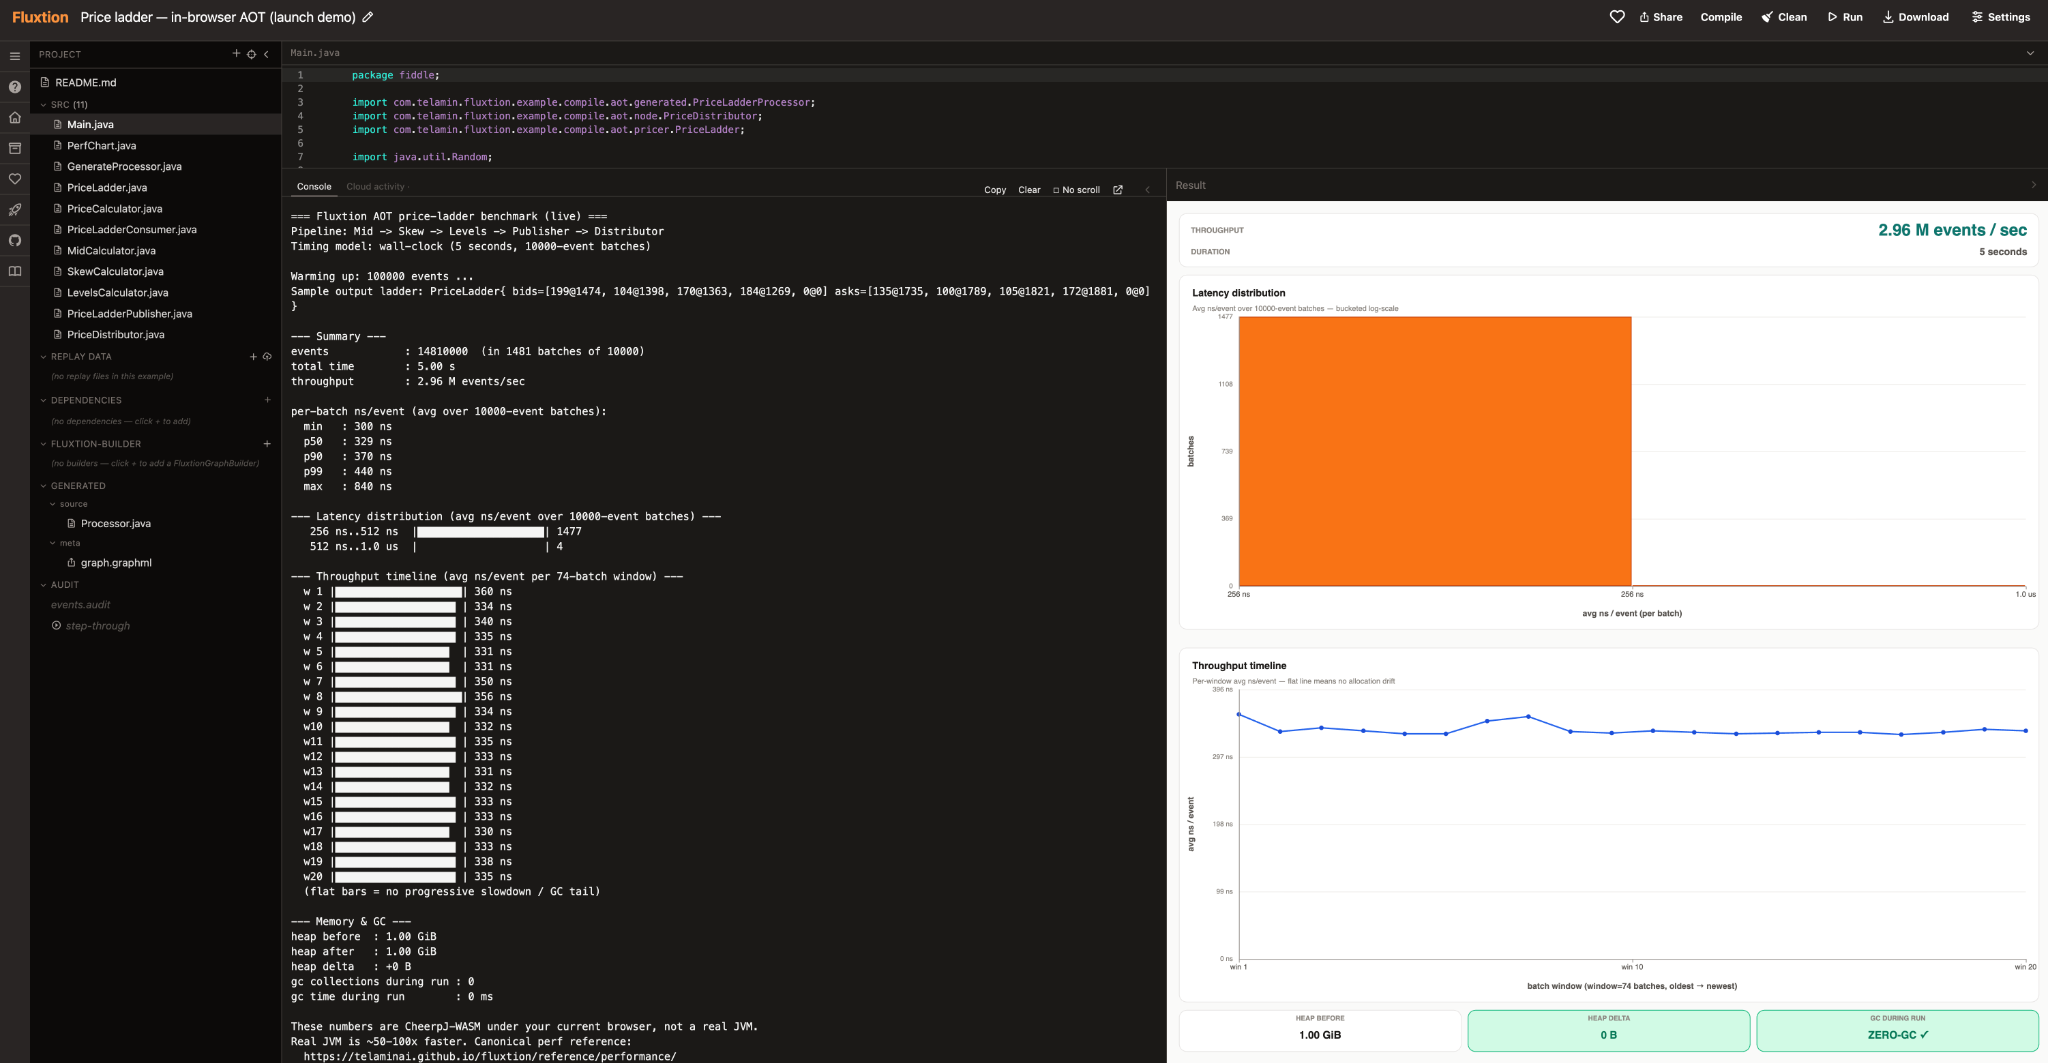
The live price-ladder benchmark on a desktop browser. The project source is on the left, the measured run is in the centre, and throughput, latency, heap delta and Java GC results are plotted on the right. Click for full size, or run it on this device.
The same benchmark recorded on an iPhone in Safari — around 2.75 million events per second on a phone.
The benchmark is open source: every file — the pipeline components, the generated processor and the measuring harness itself — is readable and editable in the Playground. Nothing is hidden behind the harness.
What is actually running in the browser?
This is not a JavaScript rewrite of the example and it is not a small hand-written WebAssembly kernel.
The project contains ordinary Java components and a pre-generated Fluxtion orchestrator. The browser environment loads the Java sources, the Fluxtion libraries and the generated processor, compiles the project as Java, and runs the resulting bytecode using CheerpJ.
CheerpJ provides a full OpenJDK-based Java runtime environment for the browser. The runtime implementation itself is built using WebAssembly and JavaScript. Java application bytecode first runs through an interpreter, and hot bytecode is then JIT-compiled to optimised JavaScript (the CheerpJ architecture documentation describes the design).
So there are two different compilation stages:
Java components + graph semantics
             ↓  Fluxtion execution inference
Generated Processor.java
             ↓  javac
Java bytecode
             ↓  browser JVM interpreter/JIT or HotSpot JIT
Executable code for the target environment
Fluxtion performs the first optimisation: it turns the graph into a specialised orchestrator before runtime. The target Java environment then optimises that already-specialised program in its normal way.
This distinction matters. The browser JVM does not have to understand the Fluxtion graph or discover its execution order. It receives an ordinary Java class in which the coordination decisions have already been encoded.
The same graph on HotSpot
The browser demonstration is deliberately a difficult environment. It proves portability and shows how little runtime machinery the generated processor needs. It is not the upper performance bound.
The equivalent price-ladder benchmark running on a desktop HotSpot JVM reports:
| Measurement | Result |
|---|---|
| Throughput | 50.87 million events/s |
| Average time | 20.234 ns/event |
| Threading | Single-threaded |
| Steady-state Java GC | Zero |
The desktop test uses JMH, feeds 10,000 randomised price-ladder events per iteration and executes the application logic in each node, not merely an empty dispatch call. It calculates a mid price, updates ladder prices with a skew, removes levels beyond a configured limit and publishes the resulting ladder. The full benchmark method, generated source, reproduction instructions and caveats are public.
This is not an apples-to-apples comparison between a phone and a server. The hardware and JVMs are different. The useful observation is that the same compiled coordination model remains efficient across both environments: roughly three million events per second in the browser demonstration and roughly fifty million on the measured desktop JVM.
The runtime does not traverse the graph
A graph is invaluable at design time. It is not necessarily the data structure you want to walk millions of times per second.
A generic graph runtime may need to identify the current node, inspect outgoing edges, evaluate routing metadata, locate the next handler and hand work to a scheduler. Fluxtion pays that coordination cost once. Execution inference calculates the event-specific path and writes the result into Java.
A simplified section of the generated price-ladder dispatcher looks like this:
isDirty_midCalculator = midCalculator.newPriceLadder(priceLadder);

if (guardCheck_skewCalculator()) {
    isDirty_skewCalculator = skewCalculator.calculateSkewedLadder();
}

if (guardCheck_levelsCalculator()) {
    isDirty_levelsCalculator = levelsCalculator.calculateLevelsForLadder();
}

if (guardCheck_publisher()) {
    publisher.publishPriceLadder();
}
There is no graph-edge lookup in this path. The graph has become code.
The generated method also shows something important about the performance claim: Fluxtion has not removed business logic. It has removed generic coordination work around the business logic.
Why the compiled orchestrator is fast
Performance specialists tend to repeat the same advice: the path to fast software is simple code, and less of it. Compiled orchestration applies that advice to the dispatch layer. The complexity of deciding who runs, when, and in what order is spent once, at compile time; what remains at runtime is a small amount of straightforward Java that both the JVM and a human reader can optimise. The developer's performance budget is then spent where it belongs — inside the components — rather than on coordination machinery around them.
The rest of this section is that principle in detail.
Direct, stable call sites
The generated dispatcher holds direct references to the node instances and repeatedly calls the same concrete targets. These stable, effectively monomorphic call sites are much easier for a JVM to devirtualise and inline than calls passing through generic subscriber, operator or handler layers.
Once inlined, the JIT can optimise across boundaries that still exist in the source model. Developers retain small, testable components; the runtime can see a compact execution path.
Small, predictable instruction paths
The dispatcher is flat and comparatively small. The CPU repeatedly executes the same event-specific path, which helps instruction-cache locality and branch prediction.
This is a claim about the generated instruction path, not a claim that Java lays every node object contiguously in memory. The node state is nevertheless touched repeatedly in a stable order, giving useful temporal locality without requiring developers to hand-pack the application into one giant class.
Short call stacks
The path from event to application code is direct:
Generated dispatcher
    → node method
    → next node method
    → publisher
There is no reactive trampoline, scheduler frame, future continuation or subscriber chain in the processor hot path. That reduces overhead and also produces stack traces that look like the program the developer wrote.
No generic runtime indirection
It would be inaccurate to say there is literally no indirection: Java still has fields, method calls and branches. The useful claim is narrower.
There is no reflection, dynamic handler lookup, graph traversal, scheduler hand-off or per-event routing object in the generated event path. The processor executes the coordination plan directly.
Change-directed execution
The dirty flags in the generated code are not incidental bookkeeping. They encode whether an upstream component changed state in a way that can affect a downstream component.
The compiler has already determined which nodes may be affected and in what order. At runtime, guard checks follow that precomputed plan and skip downstream work when the relevant state did not change. The runtime does not fan out across the graph looking for something to do.
Zero allocation on the hot path
The nodes and their state are created before event processing starts. The benchmark reuses price-ladder objects and arrays, and the generated dispatcher does not allocate a task, future, wrapper or routing record for each event.
That produces a zero-allocation steady-state hot path for this benchmark. With no per-event garbage, Java GC remains quiescent during the measured run.
This is a property developers can preserve, not magic the framework can guarantee against arbitrary user code. Logging, boxing, collection growth or object construction inside a node will reintroduce allocation and should be measured.
Single-threaded coordination
The processor uses one deterministic execution thread for this graph. The normal path does not hand each node through work queues, locks or scheduler coordination.
Parallelism can still exist outside the processor or between independent processors. The important point is that adding threads inside a tiny event path is not automatically a performance improvement. For many operational graphs, a fast single-threaded core provides lower latency, simpler replay and far more throughput than the surrounding system requires.
Fast and auditable for the same reason
High-performance systems are often treated as if they must be opaque. Generated code is assumed to be unreadable, while readable systems are assumed to need a generic runtime.
Fluxtion takes a different route. The compiler emits the artefacts needed for both execution and explanation:
Declared Java components
           ↓
Inferred GraphML topology
           ↓
Generated Java orchestrator
           ↓
Audit events and deterministic replay
The generated Java is not a hidden internal plan. It is the implementation that runs. A developer can open it in an IDE, compare it between builds, set a breakpoint on a guard check and inspect the exact order in which components execute.
The same compiled model also determines where audit hooks are placed and which path is replayed. That means the performance and audit stories share the same foundation: the execution plan is explicit.
Fluxtion is not fast despite being auditable. It is fast and auditable for the same reason: the coordination plan has been compiled into a concrete artefact.
There is an honest qualification. Writing a detailed external audit record for every event has a cost, just as logging does in any system. The benchmark measures the processor hot path; it does not synchronously serialise a verbose audit document for every one of the millions of events. The architectural advantage is that audit points, graph topology and execution order all come from the same generated model rather than being reconstructed after an incident.
Why this matters for operational AI
A probabilistic model may propose a position, classification, parameter change or action. The operational system surrounding it still has to enforce permissions, limits, state transitions and downstream effects.
Those guardrails often run at a very different rate from the model itself. A model might update a trading parameter occasionally, while the operational processor applies that parameter to every market-data event. Putting an LLM call in every event path would be unnecessary, expensive and difficult to reproduce.
A more useful split is:
Probabilistic model
       ↓ proposes state or action
Compiled validation and control graph
       ↓ enforces every operational event
Trading or operational systems
The model remains probabilistic where reasoning is useful. The event path remains deterministic where consistency, speed and reconstruction matter.
This is the performance counterpart to the argument in Graph Engineering Needs a Compiler: compile the part that should not improvise.
What this benchmark does not prove
Benchmarks are useful only when their boundary is clear.
This benchmark measures in-process event handling and application calculations. It does not measure network transport, message serialisation, a database transaction or publishing to an external broker. Calling the result “three million network messages per second” would be misleading.
It is also a deliberately compact graph. Larger graphs execute more user logic and will take longer in absolute nanoseconds, although they retain the same compiled coordination approach.
Absolute results depend on hardware, browser, operating system, JVM version, warm-up and background load. The browser demo is designed so anyone can run it on their own device; variation is expected.
Finally, compilation does not make external inputs, model responses or remote services deterministic. It fixes the event-processing schedule within the defined processor boundary.
Run it yourself
The useful thing about a browser benchmark is that nobody has to take a screenshot on trust.
- Open the live price-ladder benchmark in the Playground (on a phone, the streamlined benchmark page runs the same processor without the full IDE).
- Press Run and let it warm up.
- Inspect the throughput and latency distribution.
- Open
Processor.javaunder Generated. - Open
graph.graphmland compare the graph with the generated path. - Change the Java code and run it again.
For the server-side measurement, the JMH benchmark and reproduction command are published, along with the generated PriceLadderProcessor.java. The broader architectural explanation is on the Fluxtion performance page.
A compiler cannot eliminate the cost of the application logic. It can eliminate much of the machinery that repeatedly decides how to reach that logic.
That is what a compiled orchestrator buys:
- a precomputed execution path;
- a small amount of simple dispatch code — the coordination complexity spent at compile time;
- direct and optimisable calls;
- no generic graph traversal;
- no steady-state hot-path allocation in a well-designed graph;
- deterministic replay;
- generated source and topology that remain open to inspection.
The runtime is fast because it has almost nothing left to decide.
The compiler generates the orchestrator. The runtime gets out of the way.